Latent Dynamics CRF
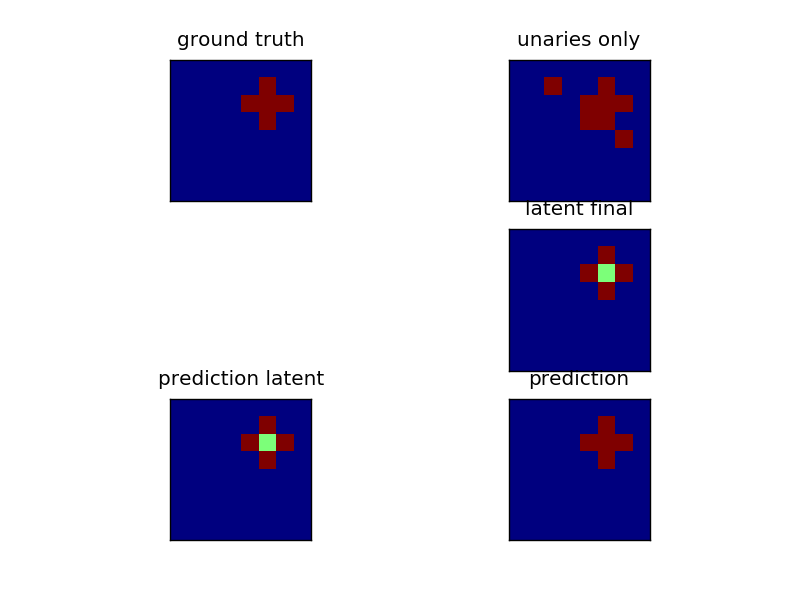
Solving a 2d grid problem by introducing latent variable interactions. The input data is the same as in plot_grid_crf, a cross pattern. But now, the center is not given an extra state. That makes the problem much harder to solve for a pairwise model. We can still solve it by introducing latent dynamics. In essence we allow an additional state with different interactions, that maps to the same state (the cross) in the ground truth.
Script output:
Score training set: 1.000000
Score test set: 0.995313
import numpy as np
import matplotlib.pyplot as plt

from sklearn.cross_validation import train_test_split

from pystruct.models import LatentGridCRF
from pystruct.learners import LatentSSVM, OneSlackSSVM

from pystruct.datasets import generate_crosses


X, Y = generate_crosses(n_samples=20, noise=5, n_crosses=1, total_size=8)
X_train, X_test, Y_train, Y_test = train_test_split(X, Y, test_size=.5)

crf = LatentGridCRF(n_states_per_label=[1, 2])
base_ssvm = OneSlackSSVM(model=crf, C=10., n_jobs=-1, inference_cache=20,
                         tol=.1)
clf = LatentSSVM(base_ssvm=base_ssvm)
clf.fit(X_train, Y_train)
print("Score training set: %f" % clf.score(X_train, Y_train))
print("Score test set: %f" % clf.score(X_test, Y_test))

Y_pred = clf.predict(X_test)

x, y, y_pred = X_test[1], Y_test[1], Y_pred[1]
fig, ax = plt.subplots(3, 2)
ax[0, 0].matshow(y, vmin=0, vmax=crf.n_labels - 1)
ax[0, 0].set_title("ground truth")
ax[0, 1].matshow(np.argmax(x, axis=-1),
                 vmin=0, vmax=crf.n_labels - 1)
ax[0, 1].set_title("unaries only")
ax[1, 0].set_visible(False)
ax[1, 1].matshow(crf.latent(x, y, clf.w),
                 vmin=0, vmax=crf.n_states - 1)
ax[1, 1].set_title("latent final")
ax[2, 0].matshow(crf.inference(x, clf.w),
                 vmin=0, vmax=crf.n_states - 1)
ax[2, 0].set_title("prediction latent")
ax[2, 1].matshow(y_pred,
                 vmin=0, vmax=crf.n_labels - 1)
ax[2, 1].set_title("prediction")
for a in ax.ravel():
    a.set_xticks(())
    a.set_yticks(())

plt.show()
Total running time of the script: (0 minutes 4.361 seconds)
Download Python source code: plot_latent_crf.py