Learning directed interactions on a 2d grid
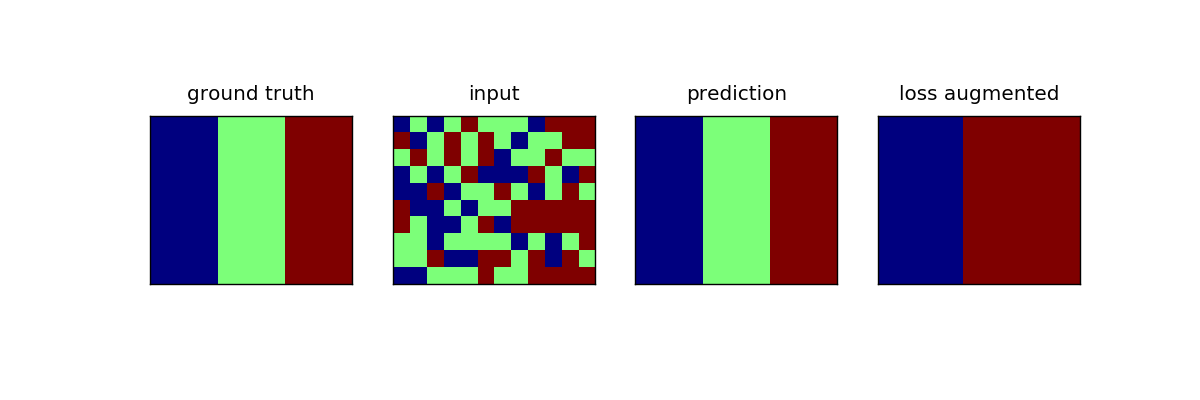
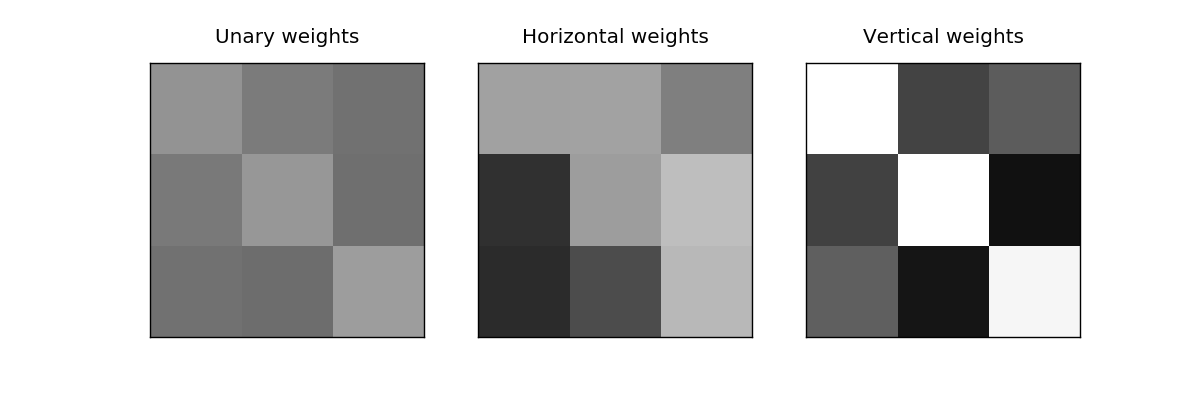
Simple pairwise model with arbitrary interactions on a 4-connected grid. There are different pairwise potentials for the four directions. All the examples are basically the same, three vertical stripes. Only the noise differs. The CRF learns that it can smooth strongly along the vertical axis and that there is a specific order in the horizontal direction (see off-diagonal).
Script output:
overall accuracy (training set): 0.945417
import numpy as np
import matplotlib.pyplot as plt

from pystruct.models import DirectionalGridCRF
import pystruct.learners as ssvm
from pystruct.datasets import generate_blocks_multinomial


X, Y = generate_blocks_multinomial(noise=2, n_samples=20, seed=1)
crf = DirectionalGridCRF(inference_method="qpbo", neighborhood=4)
clf = ssvm.OneSlackSSVM(model=crf, n_jobs=-1, inference_cache=100, tol=.1)

clf.fit(X, Y)

Y_pred = np.array(clf.predict(X))
print("overall accuracy (training set): %f" % clf.score(X, Y))

# plot one example
x, y, y_pred = X[0], Y[0], Y_pred[0]
y_pred = y_pred.reshape(x.shape[:2])
fig, plots = plt.subplots(1, 4, figsize=(12, 4))
plots[0].matshow(y)
plots[0].set_title("ground truth")
plots[1].matshow(np.argmax(x, axis=-1))
plots[1].set_title("input")
plots[2].matshow(y_pred)
plots[2].set_title("prediction")
loss_augmented = clf.model.loss_augmented_inference(x, y, clf.w)
loss_augmented = loss_augmented.reshape(y.shape)
plots[3].matshow(loss_augmented)
plots[3].set_title("loss augmented")
for p in plots:
    p.set_xticks(())
    p.set_yticks(())

# visualize weights
w = clf.w.reshape(3, 3, 3)
fig, plots = plt.subplots(1, 3, figsize=(12, 4))
plots[0].matshow(w[0], cmap='gray', vmin=-5, vmax=5)
plots[0].set_title("Unary weights")
plots[1].matshow(w[1], cmap='gray', vmin=-5, vmax=5)
plots[1].set_title("Horizontal weights")
plots[2].matshow(w[2], cmap='gray', vmin=-5, vmax=5)
plots[2].set_title("Vertical weights")
for p in plots:
    p.set_xticks(())
    p.set_yticks(())
plt.show()
Total running time of the script: (0 minutes 5.241 seconds)
Download Python source code: plot_directional_grid.py