Learning interactions on a 2d grid
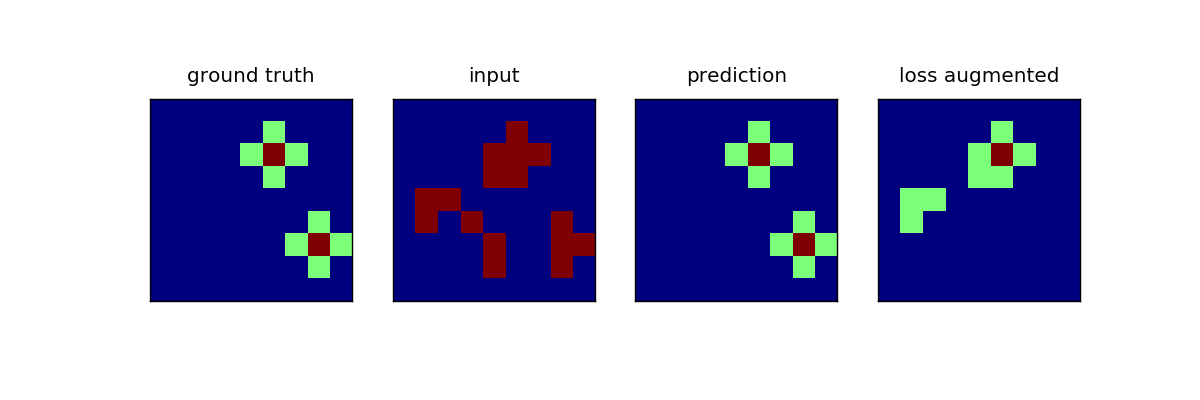
Simple pairwise model with arbitrary interactions on a 4-connected grid. The inputs contain a cross pattern with a separate state for the center. The crosses are placed randomly in the image and noise is added.
The center state is not encoded in the input, so that the task can not be solved without pairwise interactions.
Script output:
overall accuracy (training set): 0.985926
import numpy as np
import matplotlib.pyplot as plt
from pystruct.models import GridCRF
import pystruct.learners as ssvm
from pystruct.datasets import generate_crosses_explicit
from pystruct.utils import expand_sym
X, Y = generate_crosses_explicit(n_samples=50, noise=10)
crf = GridCRF(neighborhood=4)
clf = ssvm.OneSlackSSVM(model=crf, C=100, inference_cache=100,
tol=.1)
clf.fit(X, Y)
Y_pred = np.array(clf.predict(X))
print("overall accuracy (training set): %f" % clf.score(X, Y))
# plot one example
x, y, y_pred = X[0], Y[0], Y_pred[0]
y_pred = y_pred.reshape(x.shape[:2])
fig, plots = plt.subplots(1, 4, figsize=(12, 4))
plots[0].matshow(y)
plots[0].set_title("ground truth")
plots[1].matshow(np.argmax(x, axis=-1))
plots[1].set_title("input")
plots[2].matshow(y_pred)
plots[2].set_title("prediction")
loss_augmented = clf.model.loss_augmented_inference(x, y, clf.w)
loss_augmented = loss_augmented.reshape(y.shape)
plots[3].matshow(loss_augmented)
plots[3].set_title("loss augmented")
for p in plots:
p.set_xticks(())
p.set_yticks(())
# visualize weights
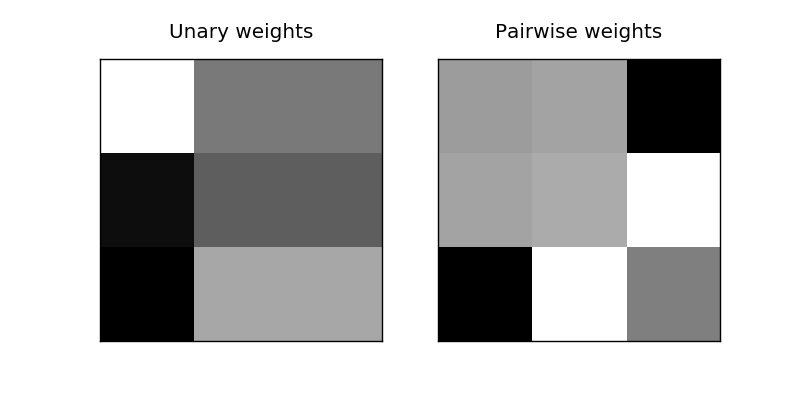
w_un = clf.w[:3 * 3].reshape(3, 3)
# decode the symmetric pairwise potential
w_pw = expand_sym(clf.w[3 * 3:])
fig, plots = plt.subplots(1, 2, figsize=(8, 4))
plots[0].matshow(w_un, cmap='gray', vmin=-5, vmax=5)
plots[0].set_title("Unary weights")
plots[1].matshow(w_pw, cmap='gray', vmin=-5, vmax=5)
plots[1].set_title("Pairwise weights")
for p in plots:
p.set_xticks(())
p.set_yticks(())
plt.show()
Total running time of the script: (0 minutes 13.651 seconds)
Download Python source code: plot_grid_crf.py