Comparing inference times on a simple Potts model
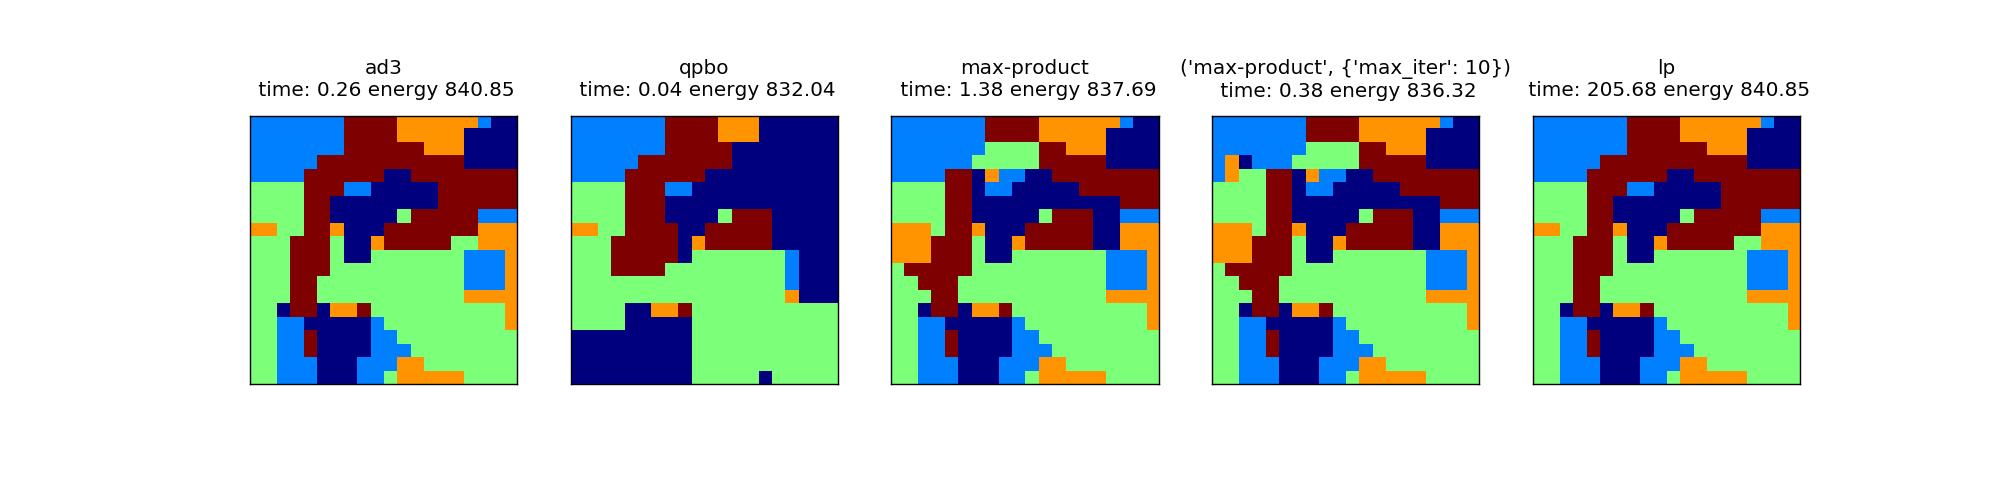
Simple comparison of inference times on a Potts model (smoothing) on a 2d grid of random noise of 5 classes.
The plots show the label results together with energies (lower is better) and inference time. The results are quite representative of the algorithms in general. AD3 is quite fast and gives good results (identical to lp), while the general purpose lp solver is too slow for practical purposes. QPBO is somewhat worse than the other methods, but significantly faster. Our implementation of max-product message passing is not competative with the high quality solutions found by AD3.
import numpy as np
import matplotlib.pyplot as plt

from time import time

from pystruct.inference import inference_dispatch, compute_energy
from pystruct.utils import make_grid_edges

size = 20
n_states = 5

rnd = np.random.RandomState(2)
x = rnd.normal(size=(size, size, n_states))
pairwise = np.eye(n_states)
edges = make_grid_edges(x)
unaries = x.reshape(-1, n_states)

fig, ax = plt.subplots(1, 5, figsize=(20, 5))
for a, inference_method in zip(ax, ['ad3', 'qpbo', 'max-product',
                                    ('max-product', {'max_iter': 10}), 'lp']):
    start = time()
    y = inference_dispatch(unaries, pairwise, edges,
                           inference_method=inference_method)
    took = time() - start
    a.matshow(y.reshape(size, size))
    energy = compute_energy(unaries, pairwise, edges, y)
    a.set_title(str(inference_method) + "\n time: %.2f energy %.2f" % (took, energy))
    a.set_xticks(())
    a.set_yticks(())
plt.show()
Total running time of the script: (3 minutes 28.006 seconds)
Download Python source code: plot_potts_model.py